


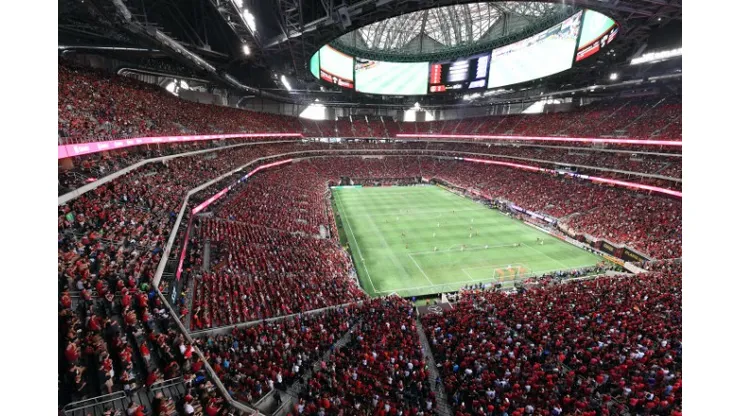
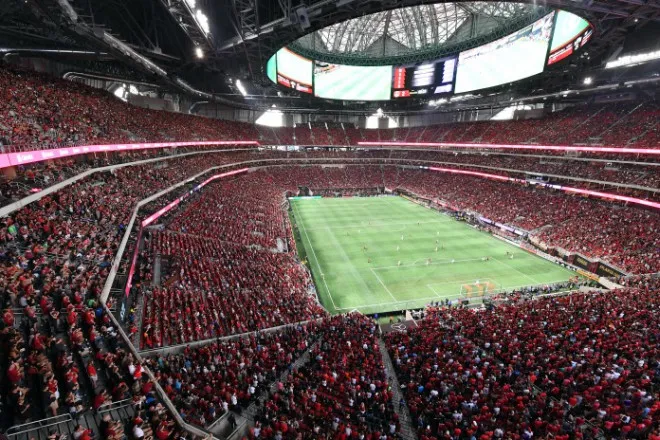
Atlanta United broke the MLS attendance record with a massive crowd of 70,425 this past Saturday in the draw against Orlando City SC.
Aided by Atlanta’s large attendances for their two recent home matches, MLS had a strong week of reported attendances for most teams across the league.
However, there were poor turnouts for Chicago Fire, Colorado Rapids and FC Dallas games.
After 315 matches, the average attendance (21,709) is up 0.96% vs 2016.
Latest attendance numbers for MLS teams:
| Franchise | Attendance |
|---|---|
| Atlanta | 42,511 |
| Atlanta | 70,425 |
| Chicago | 15,643 |
| Colorado | 14,336 |
| Dallas | 15,124 |
| Kansas City | 19,089 |
| Los Angeles | 19,650 |
| Montreal | 20,801 |
| NY Red Bull | 20,534 |
| Salt Lake | 19,677 |
| San Jose | 18,000 |
| Vancouver | 17,368 |
| Vancouver | 20,592 |

| MLS Attendance – Equal # of Home Games | ||||
|---|---|---|---|---|
| 2016 | 2017 | |||
| Att | Att | Att +/- | GP | |
| Atlanta | NA | 47,926 | NA | 12 |
| Seattle | 42,553 | 43,400 | 1.99% | 14 |
| Toronto | 27,190 | 27,447 | 0.94% | 14 |
| Orlando | 31,873 | 25,235 | -20.83% | 14 |
| NYCFC | 27,130 | 23,278 | -14.20% | 15 |
| LA Galaxy | 24,967 | 22,305 | -10.66% | 15 |
| Vancouver | 22,046 | 21,322 | -3.28% | 15 |
| Portland | 21,144 | 21,144 | 0.00% | 14 |
| Red Bulls | 20,190 | 20,929 | 3.66% | 14 |
| San Jose | 20,344 | 20,330 | -0.07% | 14 |
| Montreal | 20,950 | 20,273 | -3.23% | 15 |
| Minnesota | NA | 20,268 | NA | 15 |
| Sporting KC | 19,570 | 19,644 | 0.38% | 14 |
| Salt Lake | 19,742 | 18,693 | -5.31% | 15 |
| NE Revs | 18,218 | 18,160 | -0.32% | 14 |
| Houston | 18,835 | 17,626 | -6.42% | 13 |
| Chicago | 15,358 | 17,180 | 11.86% | 15 |
| Philadelphia Union | 17,344 | 16,511 | -4.80% | 14 |
| D.C. United | 16,490 | 15,848 | -3.89% | 15 |
| Colorado | 16,229 | 15,356 | -5.38% | 14 |
| FC Dallas | 13,944 | 15,142 | 8.59% | 15 |
| Columbus | 16,739 | 15,007 | -10.34% | 15 |
Advertisement


