
Referee errors mar Champions League semifinal
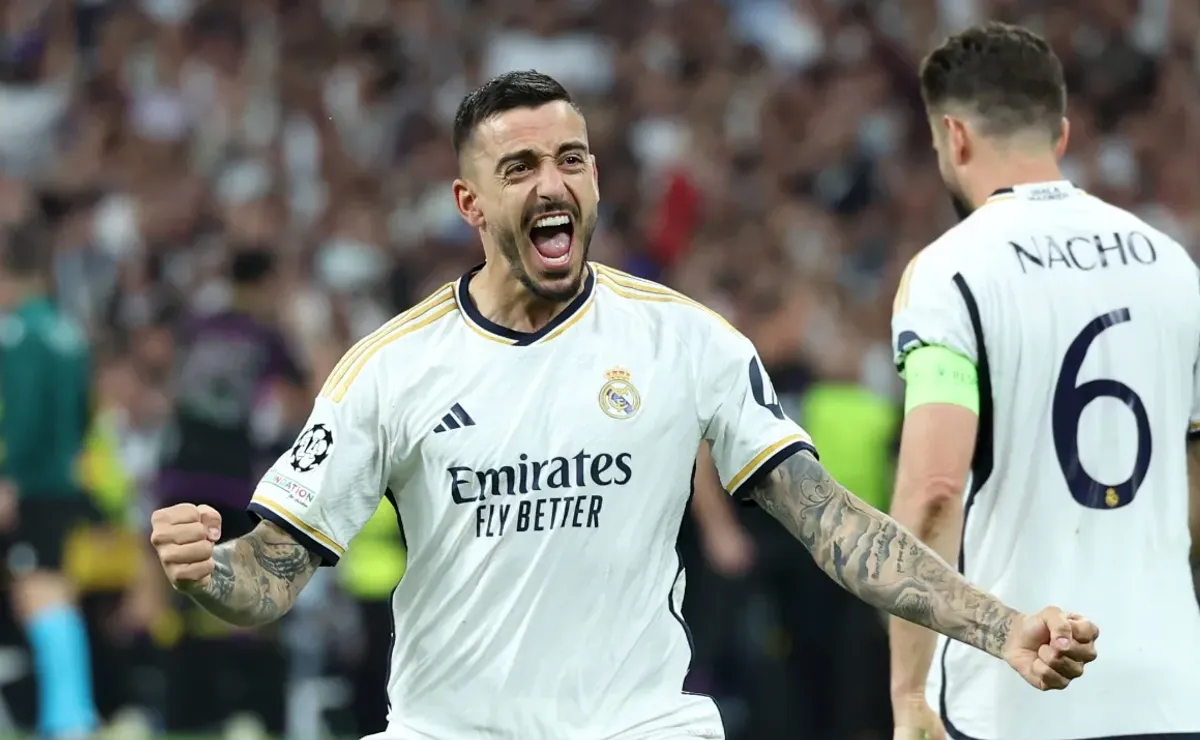
In unbelievable fashion, Real Madrid scored two late goals to reach another Champions League Final. Entering the second leg level at two goals, Bayern Munich and Real Madrid competed to take on Borussia Dortmund in the Champions League Final at Wembley. Two late goals from Joselu overturned Alphonso Davies' game-opening goal to send Real Madrid […]