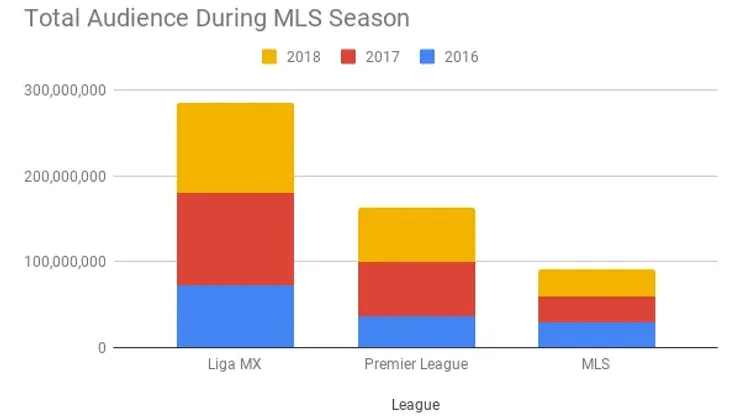
As the popularity of Liga MX and the Premier League continue to grow in the United States based on the way both leagues monopolize the most-watched games on US TV each week, MLS is getting left behind.
At World Soccer Talk, we analyzed all of the TV ratings data for 2018 to see how the three most popular soccer leagues performed. We went ahead and made it a direct comparison by only including the TV viewing numbers for the length of the MLS season to see how they did head-to-head.
Let’s look at the total TV audience numbers:
| League | 2016 | 2017 | 2018 | Grand Total |
|---|---|---|---|---|
| Liga MX | 71,961,000 | 107,969,000 | 105,636,000 | 285,566,000 |
| Premier League | 36,684,000 | 63,793,000 | 62,133,000 | 162,610,000 |
| MLS | 28,972,000 | 30,525,500 | 31,350,000 | 90,847,500 |
Based on the above data, the growth of each respective league from 2016 to 2018 is as follows:
Premier League – 69% increase
Liga MX – 46% increase
MLS – 8% increase
There are a lot of observations that can be made from the data. First, the total TV audience metric shows that MLS is dwarfed by both Liga MX and Premier League. In fact, Liga MX still continues to be the most-watched soccer league in the United States with a total TV audience delivery that had 194 million more tuning in than MLS had during the 2018 MLS season (Liga MX normally runs from January to May, and July to December). The total TV audience delivery for the Premier League is almost double that of MLS during the 2018 MLS season (March to December). However, it’s important to note that Liga MX is on national TV far more often than MLS, hence the disparity between the two different leagues. See below for the number of games televised nationally:
| Games Shown | 2016 | 2017 | 2018 | Grand Total |
|---|---|---|---|---|
| Liga MX | 123 | 196 | 230 | 549 |
| Premier League | 93 | 175 | 145 | 413 |
| MLS | 106 | 107 | 108 | 321 |
Looking at the average viewership per league on national TV, here’s where the data gets even more interesting:
| Time | Liga MX | MLS | Premier League |
|---|---|---|---|
| 2016 | 585,049 | 273,321 | 394,452 |
| 2017 | 550,862 | 285,285 | 364,531 |
| 2018 | 459,287 | 290,278 | 428,503 |
Looking at the above average viewing audiences, here’s how each league did from 2016 to 2018:
Premier League – 8.5% increase from 394,452 to 428,503
MLS – 6% increase from 273,321 to 290,278
Liga MX – 21% decrease (largely due to DISH dropping all of the Univision channels as well as showing more games featuring less popular teams)
The numbers for the Premier League would be greater during the course of the entire season, but the above metrics are based on viewing numbers during the same timeframe as the 2018 MLS season (the Premier League runs from August to May).
By limiting the number of games that are televised nationally each year, the TV metrics for Major League Soccer look better than what they would be otherwise. Increasing the number of games on national television would have an adverse result for MLS where viewing numbers overall would be dragged down by showing less popular games. At the same time, you only have to look at the total TV audience delivery at the very beginning of this article to see how Liga MX and the Premier League reach more viewers on a regular basis while retaining a decent viewing average per game.
The challenge that MLS faces when the current TV deal expires in 2022 is how they’ll be able to increase the revenue from the last deal. TV ratings on ESPN and FS1 were down last year compared to 2017. And TV ratings for the first three game weeks of the 2019 season were down 27%. At the same time, MLS has expanded the league into several new TV markets, but the league has still not been able to convert that growth into impressive TV ratings. Major League Soccer needs to increase its reach into more homes, but the demand for the league on TV is not there yet. MLS still remains the third most popular soccer league in its own country.
So while the popularity of soccer on television is growing in the United States, Liga MX and the Premier League are profiting the most while Major League Soccer’s growth is relatively static.
200+ Channels With Sports & News
- Starting price: $33/mo. for fubo Latino Package
- Watch Premier League, Women’s World Cup, Euro 2024 & Gold Cup
The New Home of MLS
- Price: $14.99/mo. for MLS Season Pass
- Watch every MLS game including playoffs & Leagues Cup
Many Sports & ESPN Originals
- Price: $10.99/mo. (or get ESPN+, Hulu & Disney+ for $14.99/mo.)
- Features Bundesliga, LaLiga, Championship, & FA Cup
2,000+ soccer games per year
- Price: $5.99/mo
- Features Champions League, Serie A, Europa League & Brasileirāo
175 Premier League Games & PL TV
- Starting price: $5.99/mo. for Peacock Premium
- Watch 175 exclusive EPL games per season


