


Last year, I analyzed the soccer TV ratings data World Soccer Talk collected for 2016. This year, World Soccer Talk writer and researcher Collin Werner has more data for the 2017 season. The 2016 data did not include the Liga MX Clausura, amounting to just over one hundred games, but that is included in 2017’s numbers. This makes it possible to compare the performance of MLS on TV to its two main broadcast rivals, Liga MX and the Premier League across the entire season. The year 2017 was also a bigger year for international games with World Cup qualifiers and the Confederations Cup. As a result, the 2017 data covers 1455 broadcast games compared to 1064 in 2016.
Table 1 below summarizes the average viewership and the number of games shown, as well as the share of total (soccer) viewership and the share of total soccer games shown. Of the pro leagues, Liga MX dominates in terms of the average with 29% of total viewership in US with only 17% of the total games shown. The Premier League has a similar share of games shown and this is comparable to its share of viewership (17% and 19% respectively). In 2016, the data suggested MLS was getting 7% market share of soccer viewers with only 6% of games played. In 2017, the numbers are reversed – 6% market share for 7% of games shown. Whatever you think of these numbers, the striking fact is that they appear to be stable.
The year 2017 was a big one for World Cup qualifiers, and so one striking difference from 2016 is that the average viewership for international games was more than twice as high – 662,000 compared to 306,000.
Table 1 suggests that among the leagues, LaLiga is quite close to MLS in terms of overall share although not in terms of average viewership per game, while the UEFA Champions League matches MLS in terms of viewership per game despite being mostly played on a midweek afternoon when most adults would be at work. By contrast, the Bundesliga is struggling to make any impact in terms of viewership despite accounting for almost 10% of soccer games shown.
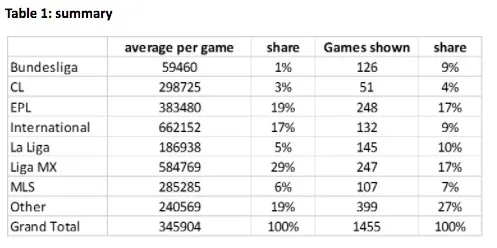
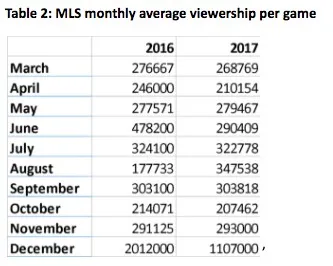
Table 2 provides a month by month breakdown of MLS games comparing the last two seasons. The pattern is broadly similar, although one noticeable difference is that the season peak in 2016 was in June while in 2017 it was in August, just as the Premier League started playing. This is mildly encouraging for MLS, although more worrying must be the drop off in October and November as the season ends and goes into the playoffs – this should be the most exciting and therefore attractive programming. No doubt competition from American football as well as European soccer getting into full swing accounts for this.
For 2016, I noted the pattern of viewership based on time slots for MLS, Liga MX and EPL – the same pattern appears in 2017 while I’ve also broken down the figures for internationals. Primetime (defined here as 8pm-11pm ET; I include games in this category if at least one entire half is played in primetime) is the most attractive slot, but because of time zones, the Premier League never plays in primetime. By contrast, 45% of MLS games and 70% of Liga MX games are played in primetime.
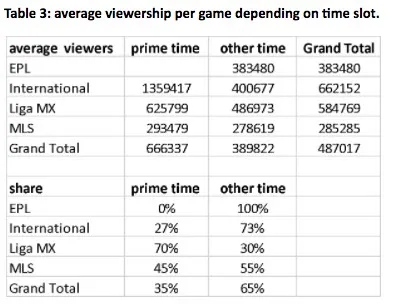
Table 3 shows that Liga MX viewership is almost 30% greater when games are played in primetime, while viewership of internationals is more than three times greater in primetime. But MLS viewership is almost identical on average whether in primetime or not. There are two effects here. Demand is higher in primetime but also games are selected for primetime showing if they are likely to be more attractive. The concern for MLS is that they seem unable to select games for primetime that turn out to be more attractive. The fact that MLS cannot get a higher viewership in primetime than the EPL can on a Saturday and Sunday morning, or that Liga MX can attract more than double the audience of MLS in primetime is bad enough. But think about how this will look when the time comes to renew the TV contract. MLS is banking on a large increase in the broadcast contract to meet the expectations of their investors, but the TV executives will just show them these figures and ask why they should shell out big bucks for a product that is so niche that it does not benefit from primetime exposure.
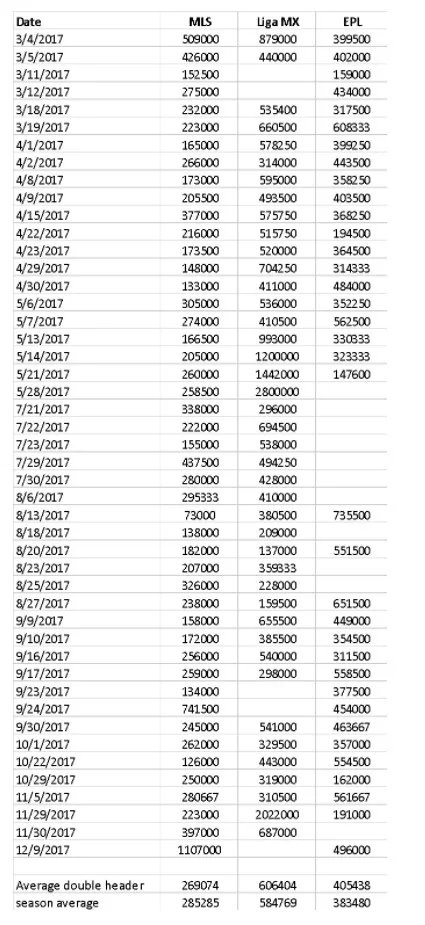
Table 4 compares all those games where an MLS game is shown on the same day as an EPL game or a Liga MX game or both. There were 47 such days in 2017. Of these, on only 4 days did MLS attract the biggest audience on the day. On these “double header” days, viewership for Liga MX and EPL was slightly higher on average, while viewership for MLS was slightly lower. For MLS, the hope must be that playing on the same day as the more popular leagues generates interest, which will trickle down to MLS. The data suggests that this is not the case.
Editor’s note: Stefan Szymanski is a university professor and author of Soccernomics (2018 World Cup Edition): Why England Loses; Why Germany, Spain, and France Win; and Why One Day Japan, Iraq, and the United States Will Become Kings of the World’s Most Popular Sport.


