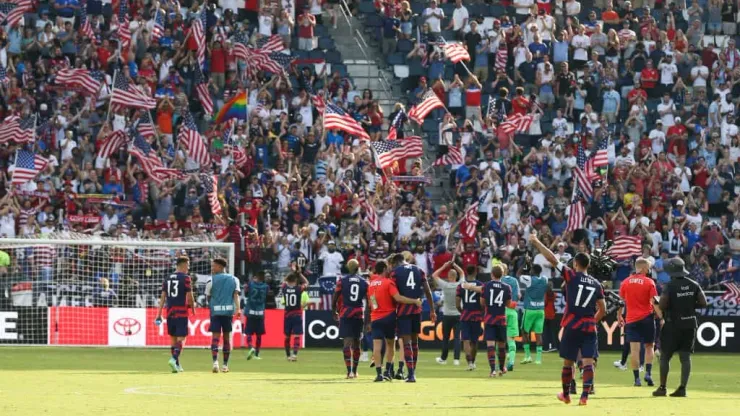
Photo by Scott Winters/Icon Sportswire via Getty Images
In 2020, the USMNT annual attendance numbers dipped drastically.
Obviously, the COVID-19 pandemic affected the soccer calendar across the world. In fact, the United States only played two games that entire year at home. First off, a February contest against Costa Rica drew 9,172 fans to Dignity Health Sports Park in Carson, CA. Then, much later on in December, 2,500 fans watched the United States play El Salvador in a COVID-conscious stadium.
With stadiums and schedules of fixtures returning to a little more normalcy, fans had more opportunities to see the USMNT in action.
To be fair, the first three games of the year all had limited capacities in the stadium. That included the CONCACAF Nations League Final against Mexico in Denver. Here is the USMNT annual attendance for its 15 home games in the calendar year.
USMNT Annual Attendance: 2021
| Date | Competition | Opponent | Stadium | City | Attendance |
|---|---|---|---|---|---|
| Jan. 1 | Friendly | Trinidad & Tobago | Exploria Stadium | Orlando, FL | 3,503 |
| June 3 | Nations League – Semifinal | Honduras | Empower Field at Mile High | Denver, CO | 34,451 |
| June 6 | Nations League – Final | Mexico | Empower Field at Mile High | Denver, CO | 37,648 |
| June 9 | Friendly | Costa Rica | Rio Tinto Stadium | Salt Lake City, UT | 19,007 |
| July 11 | Gold Cup – Group Stage | Haiti | Children’s Mercy Park | Kansas City, KS | 12,664 |
| July 15 | Gold Cup – Group Stage | Martinique | Children’s Mercy Park | Kansas City, KS | 7,511 |
| July 18 | Gold Cup – Group Stage | Canada | Children’s Mercy Park | Kansas City, KS | 18,467 |
| July 25 | Gold Cup – Quarterfinal | Jamaica | AT&T Stadium | Dallas, TX | 41,318 |
| July 29 | Gold Cup – Semifinal | Qatar | Q2 Stadium | Austin, TX | 20,500 |
| August 1 | Gold Cup – Final | Mexico | Allegiant Stadium | Las Vegas, NV | 61,514 |
| September 5 | World Cup Qualifying | Canada | Nissan Stadium | Nashville, TN | 43,028 |
| October 7 | World Cup Qualifying | Jamaica | Q2 Stadium | Austin, TX | 20,500 |
| October 13 | World Cup Qualifying | Costa Rica | Lower.com Field | Columbus, OH | 20,165 |
| November 12 | World Cup Qualifying | Mexico | TQL Stadium | Cincinnati, OH | 26,000 |
| December 18 | Friendly | Bosnia & Herzegovina | Dignity Health Sports Park | Carson, CA | 11,044 |
| TOTAL: 377,320 | |||||
| AVERAGE: 25,155 |
What does it mean?
There are several things worth noting here. First off, it’s a safe bet to assume that at least one of the Nations League games would have been a sellout but for COVID-19 restrictions.
Another thing to note is that none of the games at the Gold Cup were played with restrictions. CONCACAF selected the group stage host sites to minimize travel while allowing full capacity. That explains why all three USMNT group stage games occurred at Children’s Mercy Park in Kansas City. The downside of that is playing three games in the same stadium in the space of a week usually means poor attendance for at least one of those games. Interestingly, the USWNT frequently faces this issue during Olympic or World Cup Qualifying tournaments on home soil.
All of that being said, 2021’s average attendance of 25,155 was up 8% from an average of 23,306 in 2019. Basically, it is unfair to compare 2021 to 2020. Therefore, 2019 serves as the better litmus test as that was the last year with a full home slate of fixtures. Additionally, 2021’s USMNT annual attendance marked the highest average since 2017. That year, the squad pulled an average of 29,400 per game.
While that is certainly good news, it does unfortunately extend an unfortunate streak. For the past six years now, the USMNT failed to average audiences above 30,000 for the year. In fact, the last time the national team averaged more than 30,000 fans per game was in 2015. Then, the squad brought in an impressive 38,764 fans per game.
But with the team winning a good number of games again, and with the World Cup kicking off next year, there is belief that the 30,000 seat mark can be attained.

200+ Channels With Sports & News
- Starting price: $33/mo. for fubo Latino Package
- Watch Premier League, Women’s World Cup, Euro 2024 & Gold Cup

The New Home of MLS
- Price: $14.99/mo. for MLS Season Pass
- Watch every MLS game including playoffs & Leagues Cup

Many Sports & ESPN Originals
- Price: $10.99/mo. (or get ESPN+, Hulu & Disney+ for $14.99/mo.)
- Features Bundesliga, LaLiga, Championship, & FA Cup

2,000+ soccer games per year
- Price: $5.99/mo
- Features Champions League, Serie A, Europa League & Brasileirāo

175 Premier League Games & PL TV
- Starting price: $5.99/mo. for Peacock Premium
- Watch 175 exclusive EPL games per season