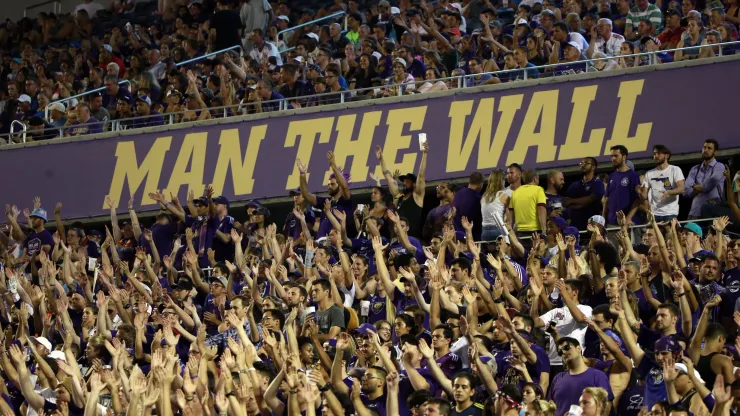
In attendances at MLS games, strong numbers are becoming routine for New York City FC, Orlando City SC, Philadelphia Union, San Jose Earthquakes and Vancouver Whitecaps. There was also a good turnout in Bridgeview for the Chicago Fire, while attendances for Colorado Rapids, New York Red Bulls and Montreal Impact have been fair.
After 190 matches, the league is maintaining a 12% increase over 2014.
Here are the latest MLS attendance numbers:
| MLS Week 19 attendances | |
|---|---|
| Chicago | 18,528 |
| Colorado | 15,248 |
| Montreal | 15,304 |
| NY Red Bull | 18,640 |
| NYCFC | 27,533 |
| Orlando | 30,513 |
| Philadelphia | 18,722 |
| San Jose | 18,000 |
| Vancouver | 21,000 |
| 2014 | 2015 | ||||||
|---|---|---|---|---|---|---|---|
| MLS Attendance – Equal # of Home Games | |||||||
| 2014 | 2014 | 2015 | |||||
| Att | Cap | Att | Att +/- | GP | % of Cap | Cap | |
| Seattle | 42,424 | 43,426 | 40,236 | -5.16% | 10 | 100.10% | 39,392 |
| Orlando | NA | NA | 34,005 | NA | 10 | 99.91% | 34,035 |
| NYCFC | NA | NA | 28,785 | NA | 10 | 93.69% | 30,722 |
| San Jose | 15,318 | 16,407 | 24,331 | 58.84% | 8 | 79.77% | 30,500 |
| Toronto | 22,591 | 22,591 | 23,802 | 5.36% | 6 | 79.34% | 30,000 |
| LA Galaxy | 20,331 | 27,000 | 21,247 | 4.50% | 12 | 78.69% | 27,000 |
| Portland | 20,799 | 20,674 | 21,144 | 1.66% | 10 | 100.00% | 21,144 |
| Vancouver | 20,988 | 21,000 | 20,752 | -1.13% | 9 | 98.82% | 21,000 |
| Houston | 19,788 | 22,039 | 20,618 | 4.19% | 10 | 93.55% | 22,039 |
| Salt Lake | 20,193 | 20,472 | 20,131 | -0.31% | 9 | 98.34% | 20,472 |
| Sporting KC | 19,842 | 18,467 | 20,025 | 0.92% | 9 | 108.43% | 18,467 |
| Red Bulls | 18,256 | 25,189 | 18,888 | 3.46% | 9 | 74.98% | 25,189 |
| Philadelphia | 18,107 | 18,500 | 17,608 | -2.76% | 11 | 95.18% | 18,500 |
| NE Revs | 15,126 | 22,500 | 16,307 | 7.81% | 10 | 72.48% | 22,500 |
| Chicago | 15,537 | 20,000 | 15,916 | 2.44% | 9 | 79.58% | 20,000 |
| Montreal | 19,394 | 27,340 | 15,589 | -19.62% | 8 | 52.60% | 25,298 |
| Colorado | 14,567 | 17,424 | 15,458 | 6.12% | 10 | 88.72% | 17,424 |
| FC Dallas | 16,459 | 20,500 | 15,274 | -7.20% | 9 | 74.51% | 20,500 |
| Columbus | 13,937 | 20,145 | 14,635 | 5.01% | 10 | 72.65% | 20,145 |
| D.C. United | 16,556 | 23,491 | 14,458 | -12.67% | 11 | 73.59% | 19,647 |
200+ Channels With Sports & News
- Starting price: $33/mo. for fubo Latino Package
- Watch Premier League, Women’s World Cup, Euro 2024 & Gold Cup
The New Home of MLS
- Price: $14.99/mo. for MLS Season Pass
- Watch every MLS game including playoffs & Leagues Cup
Many Sports & ESPN Originals
- Price: $10.99/mo. (or get ESPN+, Hulu & Disney+ for $14.99/mo.)
- Features Bundesliga, LaLiga, Championship, & FA Cup
2,000+ soccer games per year
- Price: $5.99/mo
- Features Champions League, Serie A, Europa League & Brasileirāo
175 Premier League Games & PL TV
- Starting price: $5.99/mo. for Peacock Premium
- Watch 175 exclusive EPL games per season
Loading...


